Debugging circuits
Please read http://en.wikipedia.org/wiki/Debugging for understanding what debugging means.
Basic debugging tools
In Logic Circuit program you debug circuits by assigning input values and observing outputs.
The easiest way to get different input values in the runtime is to use Constant. In design time add a constant to your circuit, select desired bit with and initial value. In the runtime you can double click the constant and it will increment its value within it bit width. So if you constant are 1 bit wide, then double clicking it will change its value from 0 to 1 and reset it back to 0 while you double clicking it. Two bit constant will get values 0, 1, 2, 3, and 0 again.
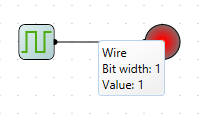
The easiest way to observe output value is clicking your mouse and hold it on wire that connected to the output of interest. While you hold mouse button a little display will be showing bit width and value transferred by wire.
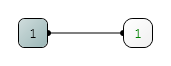
More permanent way to observe output values is to use probes. In design time add probes to your circuit and connect them to pins you want to monitor. In the runtime you will read current value on the probe.
More over probes are remembering history of values ever been measured. To see the history in the runtime double click the probe and probe dialog will pop up.
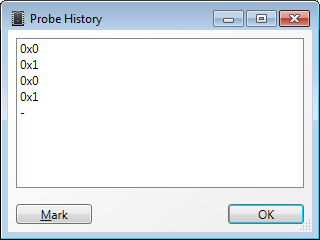
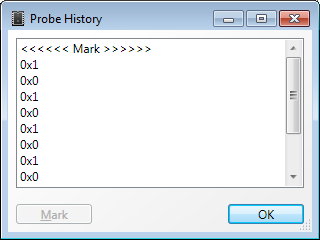
Sometimes your probe will be reading a series of values. You can mark such a series in the dialog with Mark button. When you click it a special line <<< Mark >>> will be inserted at the top of probe’s history, so all further changes will be easily separated from the earlier ones.
If you need to monitor values of a few probes at once and see how their values depend from each other you can open oscilloscope and see the dynamics of all your probes. In order to open the oscilloscope click menu Tools/Oscilloscope. This menu is enabled only in the runtime and only if you have at least one probe connected to your circuit.
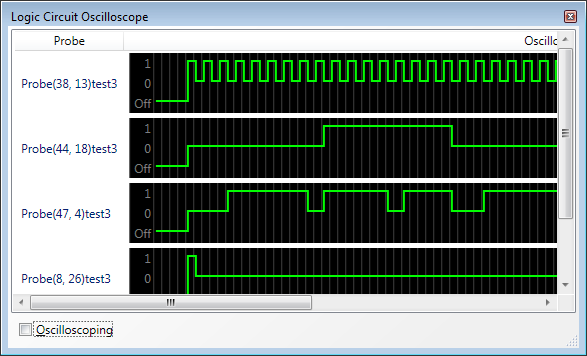
In the oscilloscope window you can start and stop measurement with Oscilloscoping check box.
Finally you can use truth table and scripts to validate your circuits.
Other debugging tips
Sometime it will be helpful to create a test circuit where you can play with your debugging circuit and see how it works. In more complicated scenarios you can to build a special environment where your debugging circuit receives a series of inputs and outputs get verified automatically.
But probably the best way is to design your circuit in small modules with clear and simple semantic so you will build error free circuits and don’t need to debug them at all.